Common Mode Failure: Two Record Borrowers, One Marginal Dollar, and the September the VIX Has Not Priced
The long end of the Treasury curve rose to a 19-year high against three consecutive soft data releases. The Bank of Japan is at its highest rate since 1995, and Japan is reducing its Treasury position. The VIX is at its year-to-date low fifteen days before four central bank decisions. A structural analysis of what these signals mean when read together.
The term "common mode failure" comes from engineering. It describes a condition in which multiple redundant systems fail simultaneously because they share a single underlying vulnerability. The systems are designed to be independent, and for most conditions they are. What they cannot survive is a fault that sits upstream of all of them.
That is the structure of the current market environment, described in the language of price rather than prediction.
The Long End Has Stopped Listening
In the first three weeks of August 2026, three separate macroeconomic data releases pointed in the direction of lower long yields. Retail sales for July fell 0.6 percent, the weakest reading since May 2025. Producer prices were unchanged. Consumer prices came in at 3.4 percent year-on-year, the second consecutive monthly decline, with the core rate at 2.5 percent.
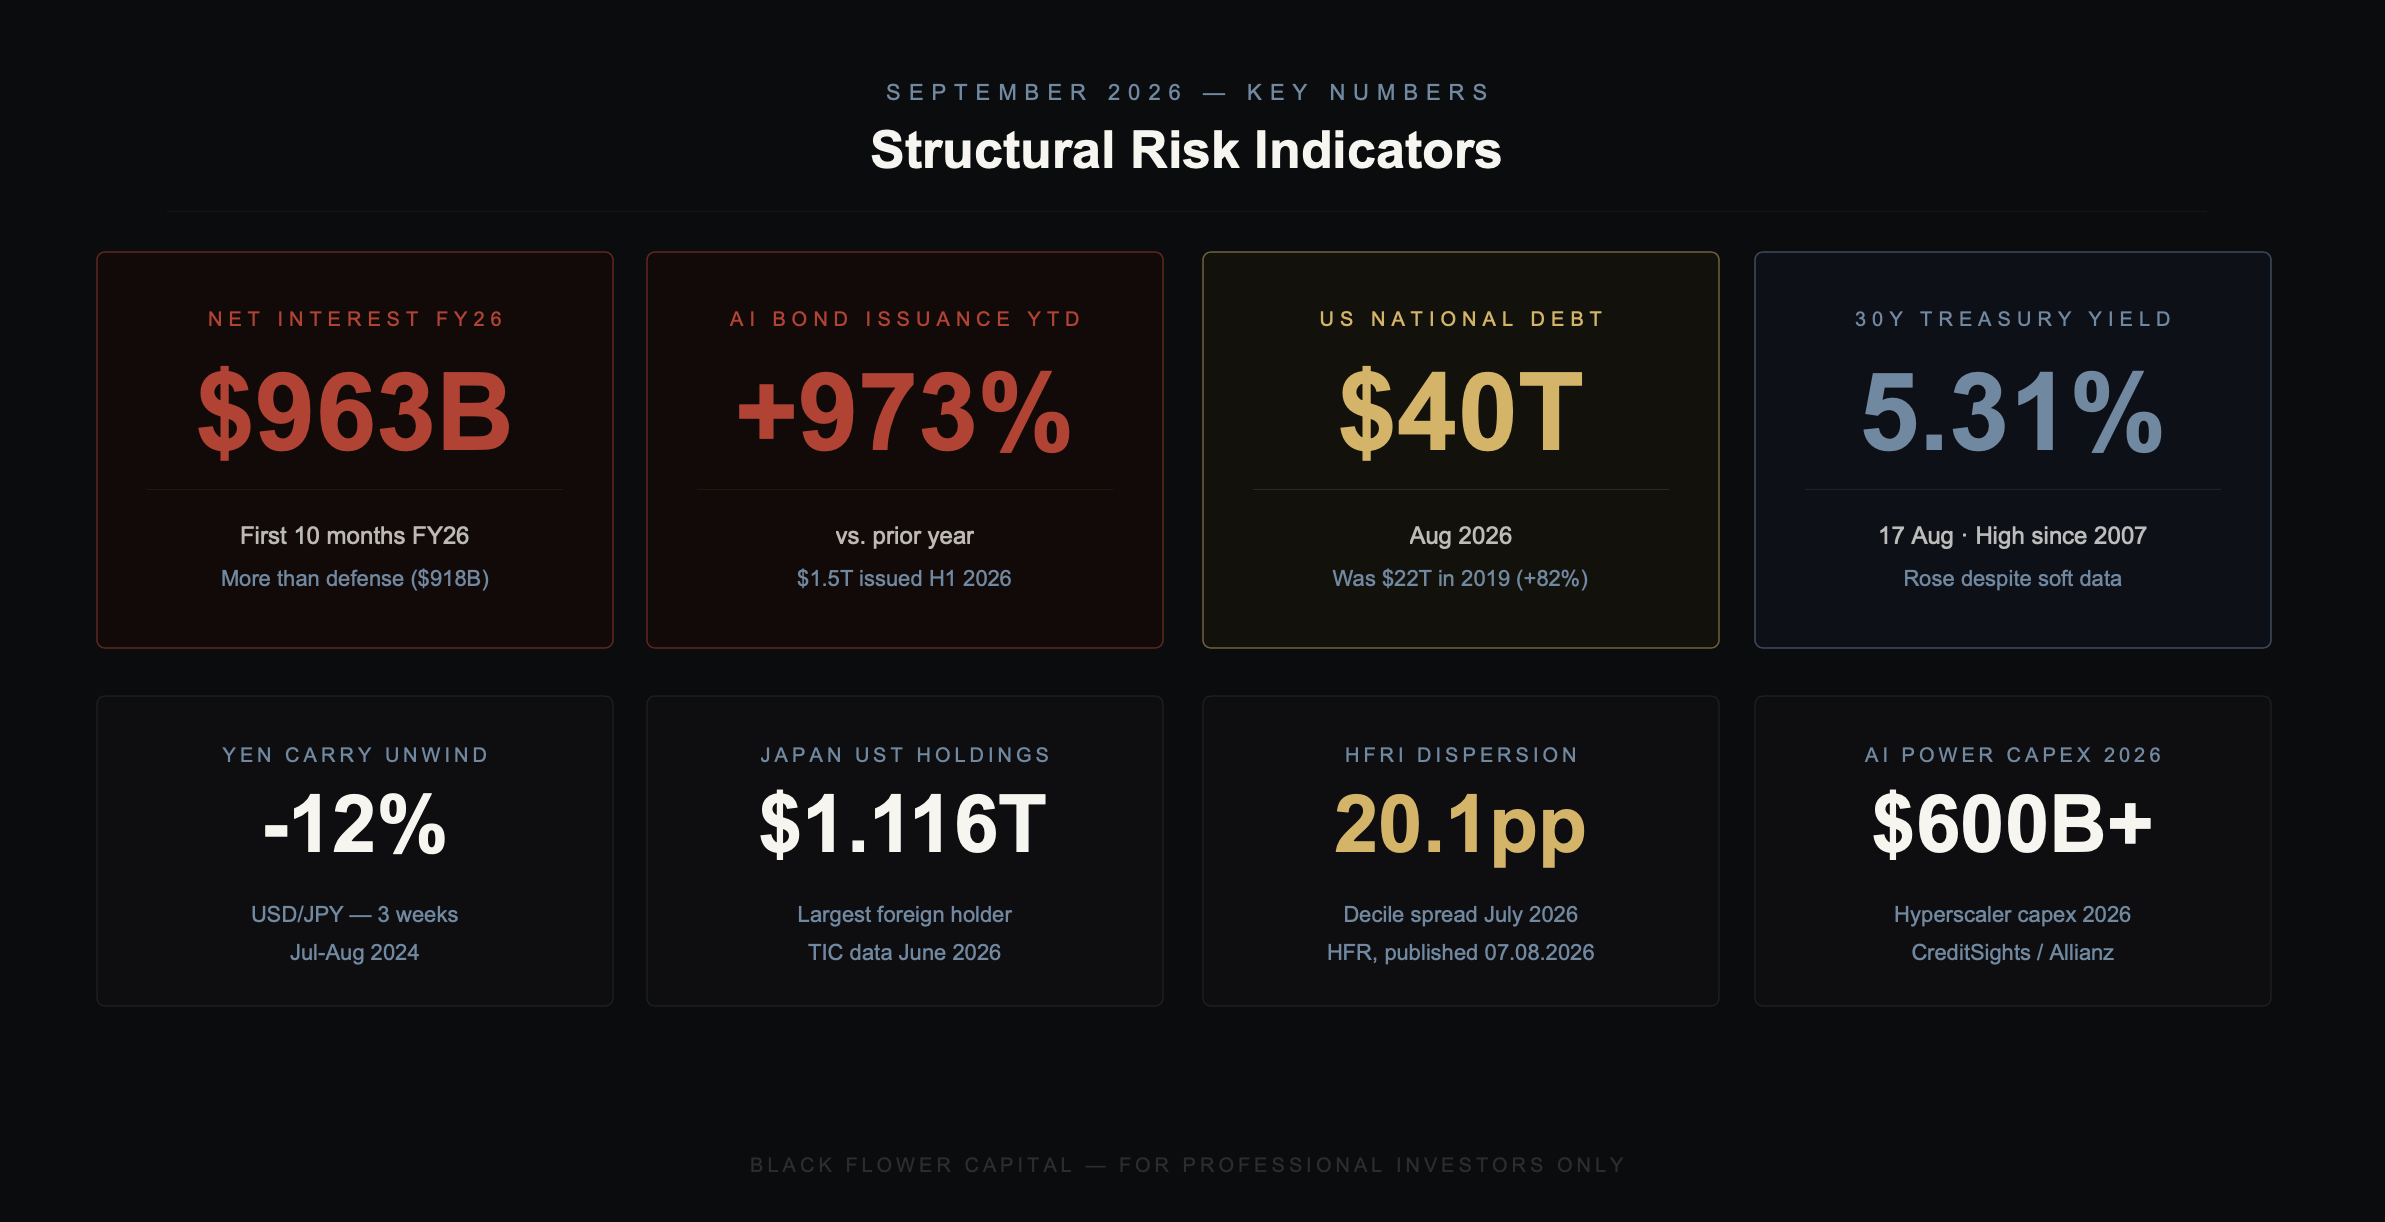
The 30-year Treasury yield rose to 5.31 percent, its highest close since 2007.
Anshul Pradhan, Head of US Rates Research at Barclays, noted on August 17 that three independent releases in August spoke for lower yields and the long end rose regardless.
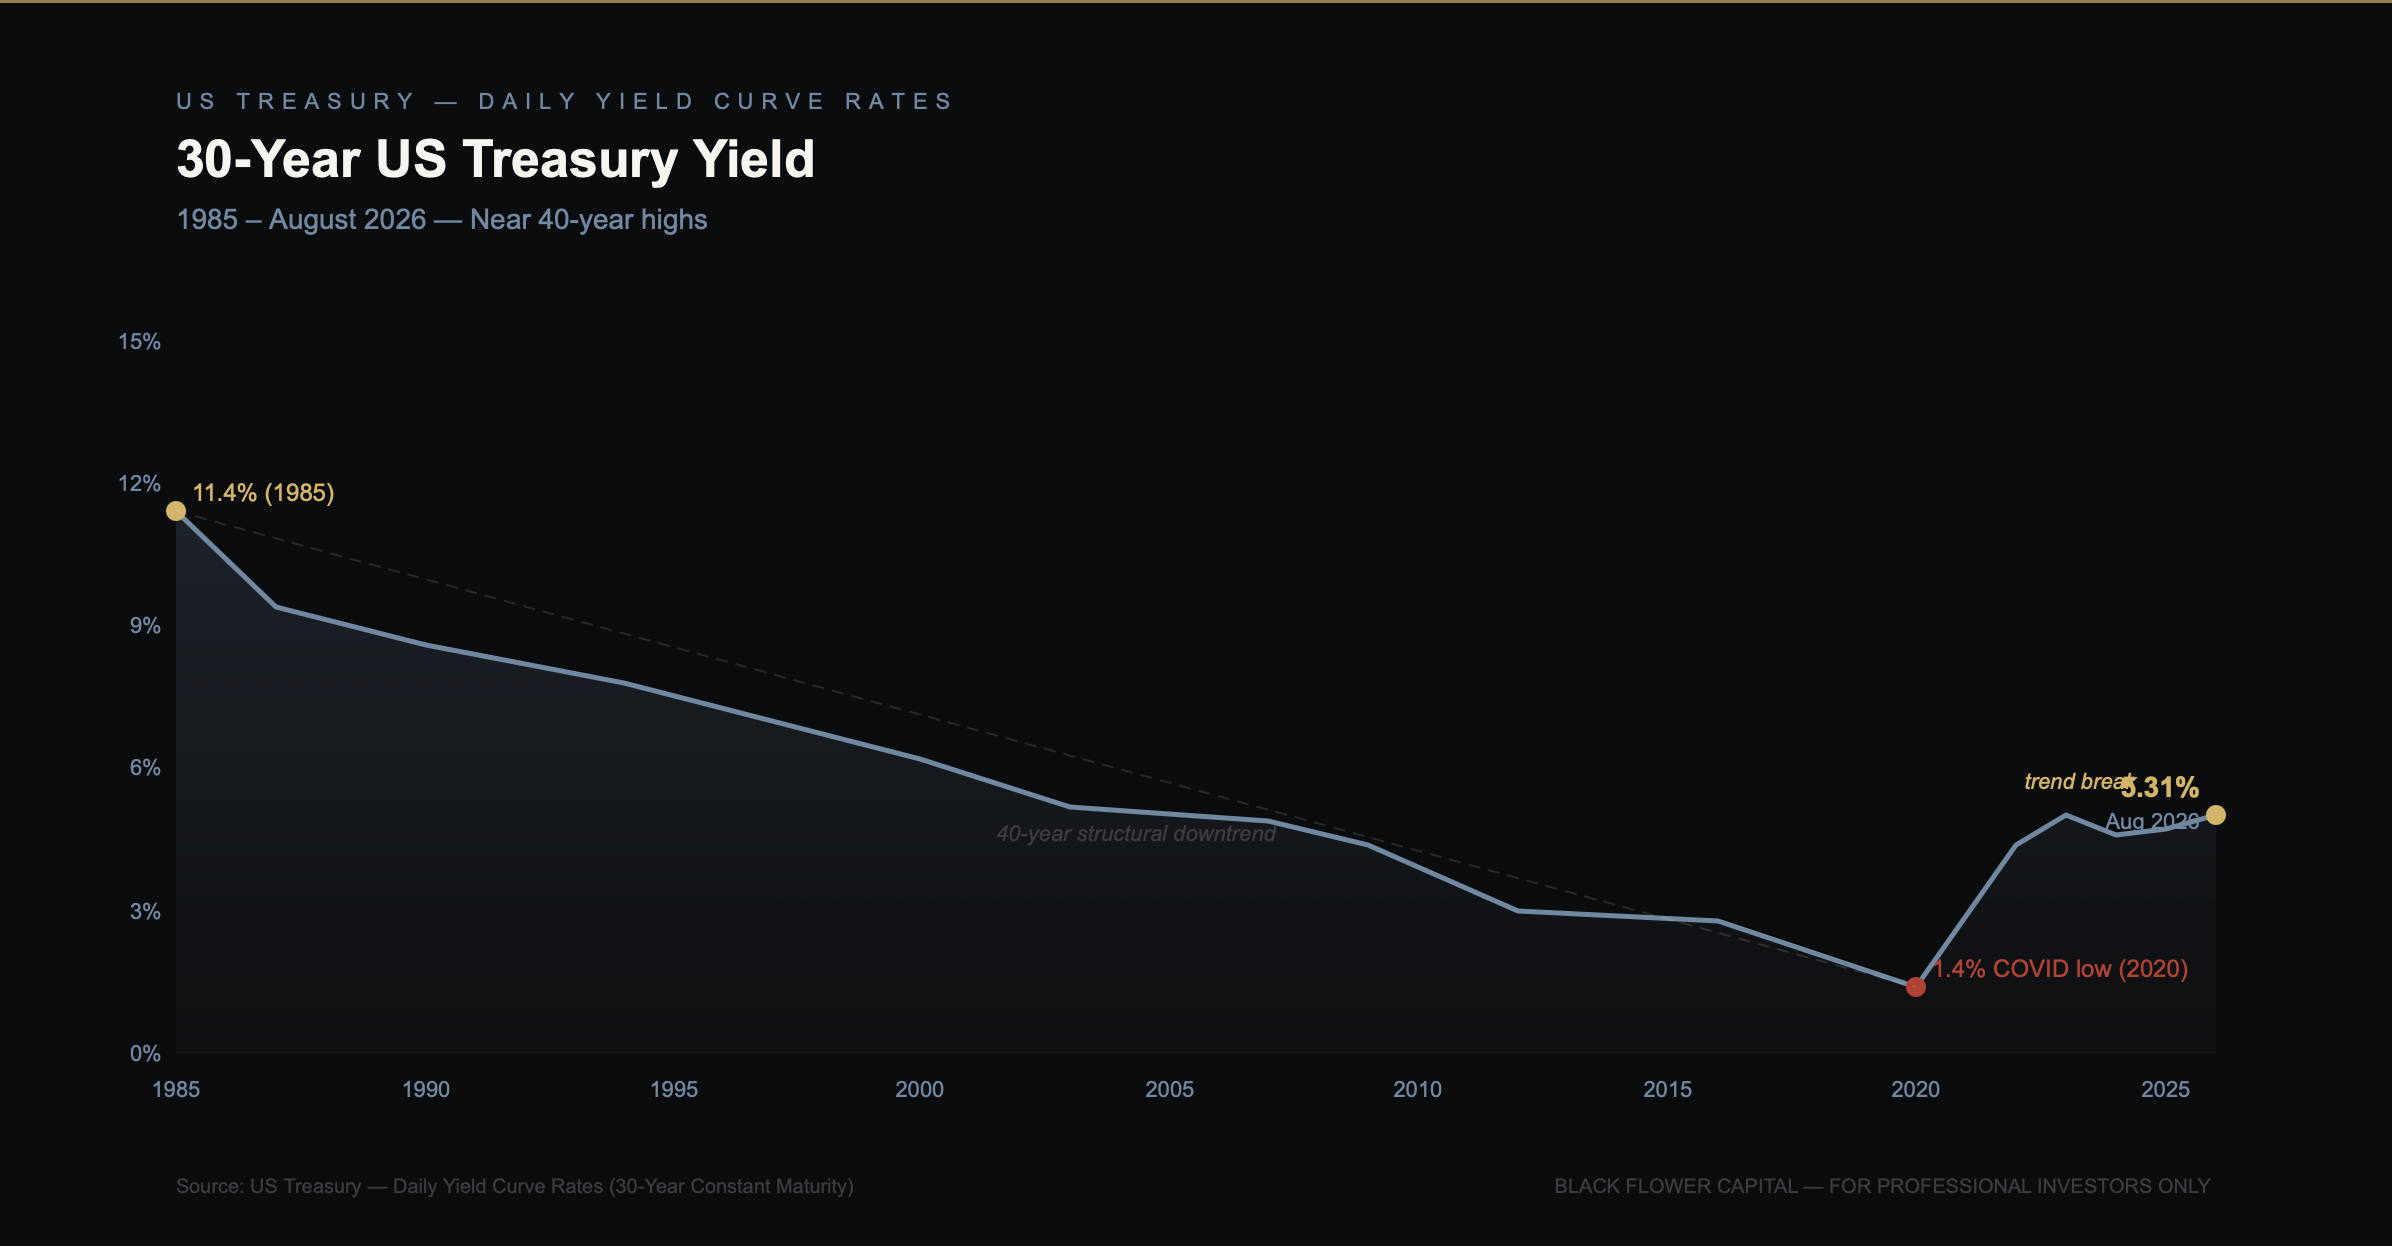
On August 19, the Treasury responded. Without prior announcement, it doubled its buyback operations in long maturities from a minimum of two to a minimum of four billion dollars per operation, targeting the 10-to-20 and 20-to-30 year segments. Yields fell approximately ten basis points. Within a single trading session the move was fully reversed.
Maia Crook, Senior Research Analyst at JPMorgan Chase, wrote that the interventions addressed the symptoms without touching the cause, and that the more durable effect was a higher risk premium for a Treasury that had departed from the principle of regular and predictable issuance.
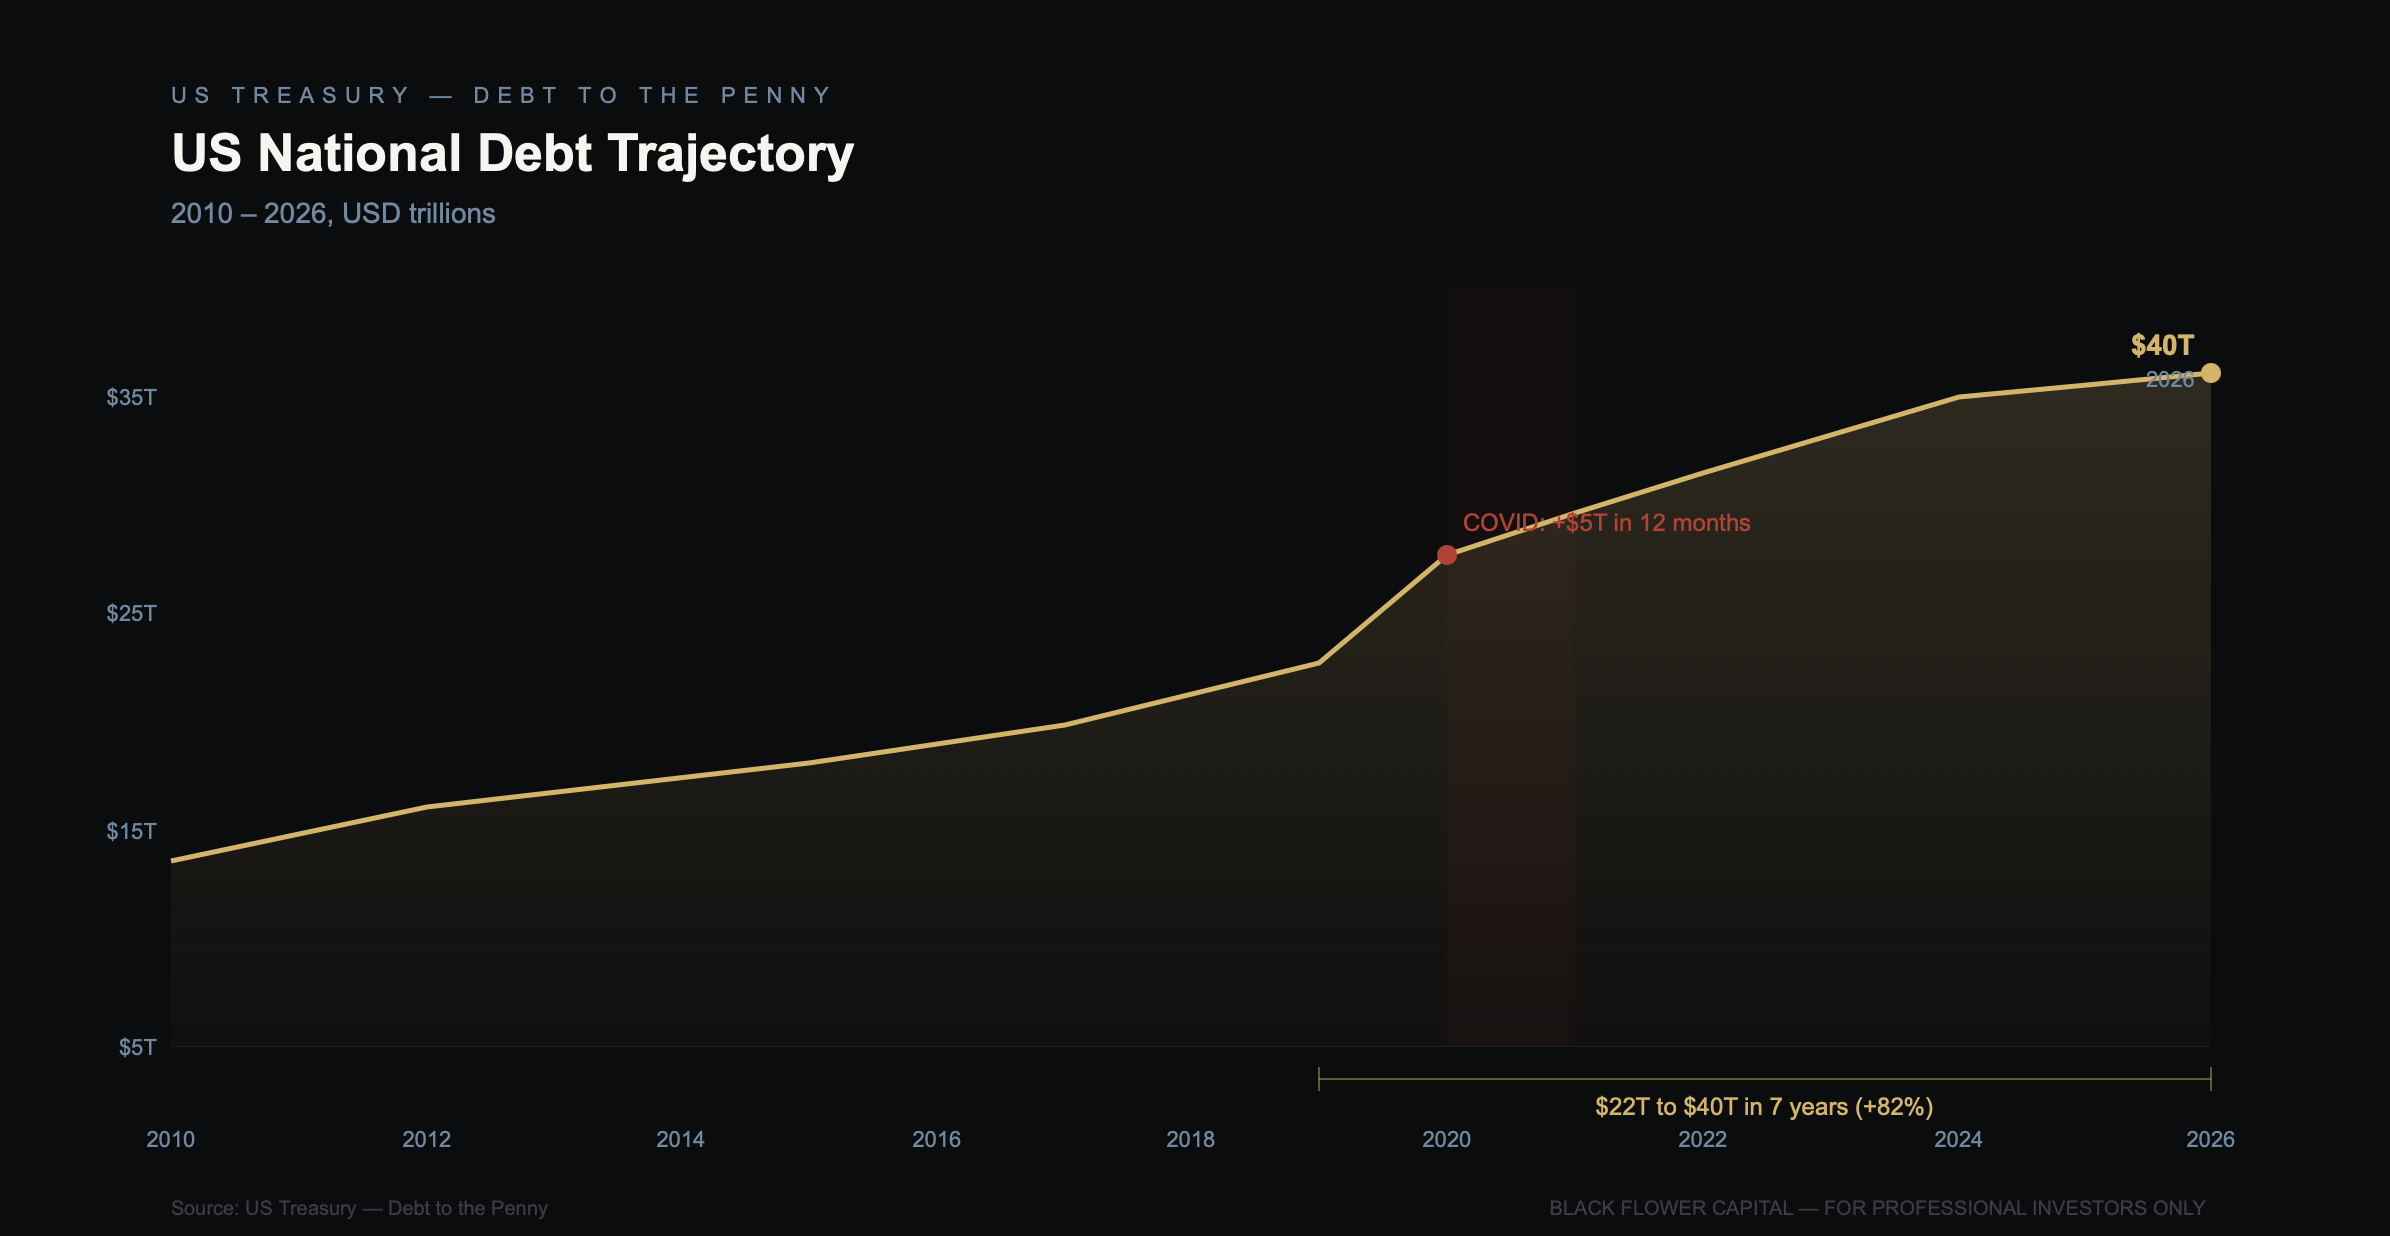
The cause is visible in the numbers. US gross debt crossed 40 trillion dollars on August 18, 2026. Net interest payments for the first ten months of fiscal year 2026 reached 963 billion dollars, approximately 200 billion more than defense spending in the same period. The Congressional Budget Office projects net interest will exceed one trillion dollars for the full fiscal year and that debt held by the public will reach 101 percent of GDP in 2026 and 120 percent by 2036. The 30-year Treasury auction on August 14 cleared at 5.216 percent, the highest auction yield since 2001.
Against this fiscal supply, a second record borrower is competing for the same marginal dollar. AI-related bond issuance by hyperscalers and connected entities reached 225 billion dollars in the first half of 2026, a 973.7 percent increase over the prior year. Nvidia priced a 25 billion dollar bond, its first issuance in five years. Capital Economics estimates that if the first-half pace continues, combined corporate and government issuance measured as a share of GDP will reach the highest level recorded outside the pandemic period.
When the marginal buyer for duration is also the marginal buyer for AI infrastructure credit, the soft data signal that formerly moved the long end competes against structural supply pressure that is indifferent to it. The divergence between the macro data and the yield response is not a market inefficiency. It is the market pricing something the data releases do not contain.
Japan: The Missing Link
The chain connecting the long-end anomaly to the September calendar runs through Tokyo.
The Bank of Japan raised its policy rate to 1.0 percent on June 17, the highest level since September 1995. The June vote was 7 to 1. At the July meeting the rate was held at 1.0 percent, with dissenter Takata Hajime voting for an immediate increase to 1.25 percent. The next scheduled decision is September 17 and 18. One additional hike is priced into market expectations.
In parallel, Japan has been reducing its Treasury holdings. US Treasury International Capital data published August 17 shows Japan's position fell from 1.143 trillion to 1.116 trillion dollars in June alone, the third decline in four months. Combined, the three largest foreign Treasury holders reduced their positions by 61 billion dollars in that single month.
Koichi Sugisaki, Head of Japan Macro Strategy at Morgan Stanley, has noted that higher Japanese interest rates could induce Japanese investors to sell US assets and repatriate capital, pushing Treasury yields higher and raising financing costs across the US economy.
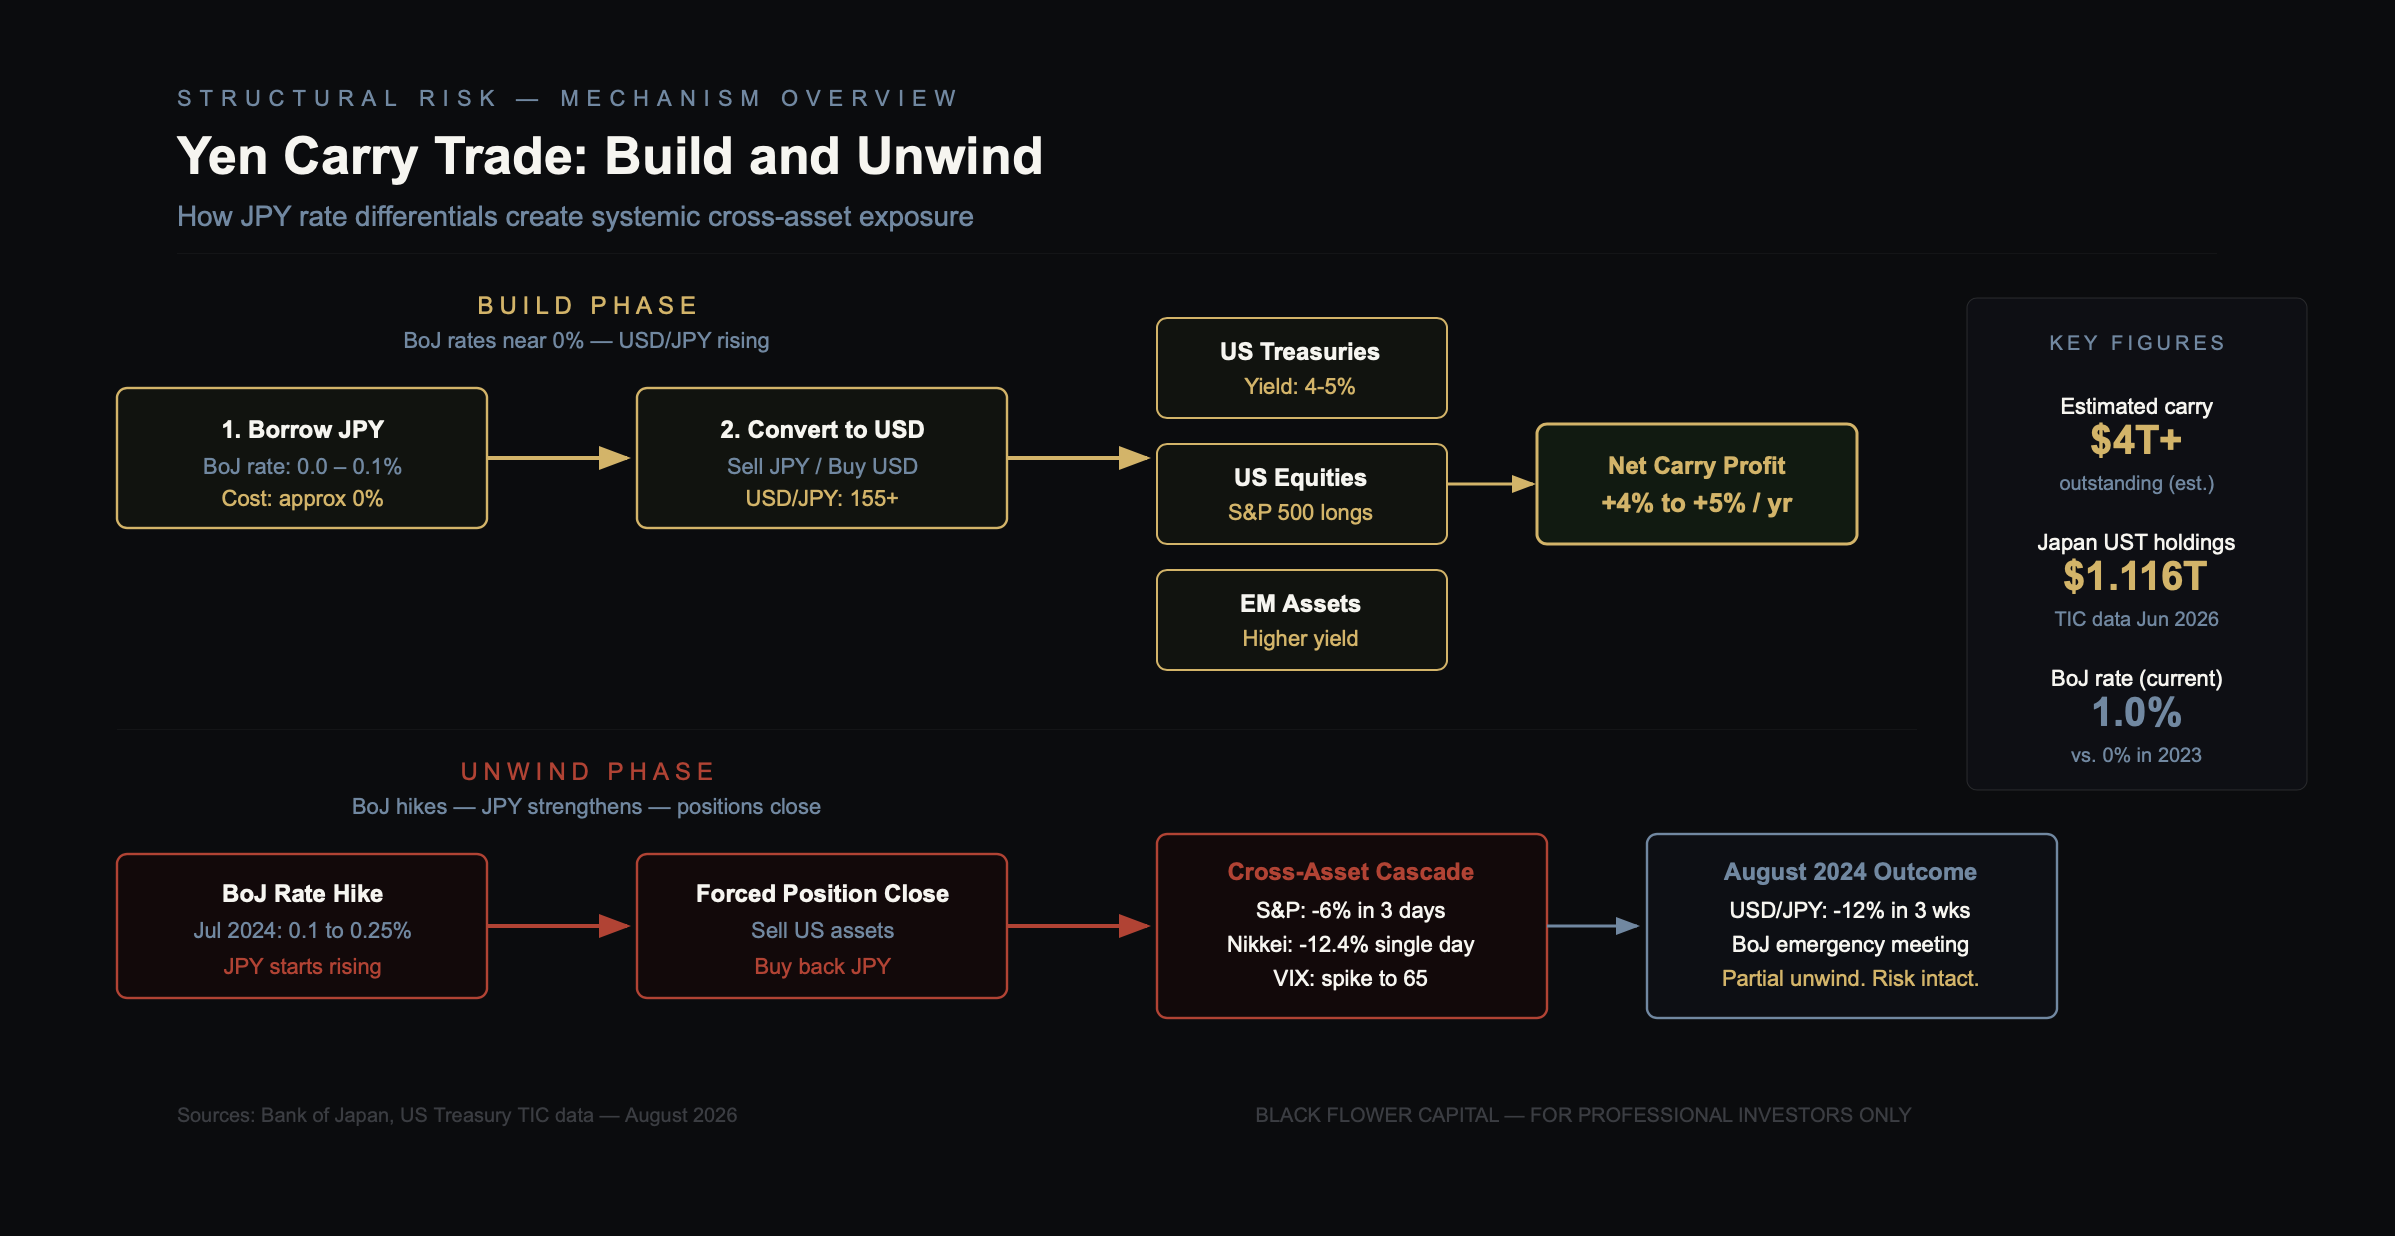
The carry trade adds a second transmission channel. In July, US and Japanese authorities conducted a joint currency intervention, with USD/JPY moving from approximately 164 to 155 before settling near 159. In the two weeks ending August 15, Japanese investors purchased more than five trillion yen of foreign equities and long-duration bonds, a reversal from the net sales of 300 billion yen in the preceding two weeks. Jesper Koll, Expert Director at Monex Group, characterised the intervention as having recharged the carry trade for fundamental and long-term investors.
The precedent is recent. When the Bank of Japan raised its rate to 0.25 percent on July 31, 2024, the Nikkei 225 fell 12.4 percent in a single session on August 5, its worst day since 1987. The VIX spiked to 65. The position has been rebuilt. The rate is now four times higher.
The Volatility Structure
The VIX closed at 14.25 on August 14, the lowest level of 2026. The September VIX future stood at 17.92, approximately 26 percent above spot. The December contract was at 20.38, 43 percent above spot. The 20-year average for the VIX is 19.60.
The term structure is pricing calm today and stress forward. The calm exists before the decisions. All four decisions fall within a single nine-day window.
A second structure is harder to see from the index alone. The VIXEQ index, which measures single-stock implied volatility, reached 49.98 on July 9, the 98th percentile of all readings since 2014. The VIX on the same day was 15.84. The gap of 34.14 points between single-stock and index volatility was an all-time record. It reflects a condition in which individual names are moving violently but not in the same direction. The spread has since narrowed to 22.12 points and remains historically wide.
The implication is direct: the VIX understates the volatility present in the system because it measures correlation-adjusted volatility, not the sum of individual moves. A macro event that forces common-direction selling raises the index mechanically, even if no individual stock's volatility changes. That is the mathematical definition of a correlation event.
CFTC Commitments of Traders data published August 21 shows non-commercial traders were net short VIX futures and options by 89,446 contracts as of August 18, up from 63,413 on July 28. That is a 41 percent increase in three weeks. Open interest on August 18 was 417,783 contracts, up 35,761 in a single week. The net short position reached its current level while the VIX was declining to its year-to-date low.
Three Sources of Leverage, One Condition
FINRA margin debt reached a record 1.53 trillion dollars in June 2026, up 51.5 percent year-on-year. The largest annual increase recorded outside the approaches to 2000, 2007, and 2021. The net credit balance, the difference between free credits and debit balances in margin accounts, stood at minus 1.06 trillion dollars, also a record.
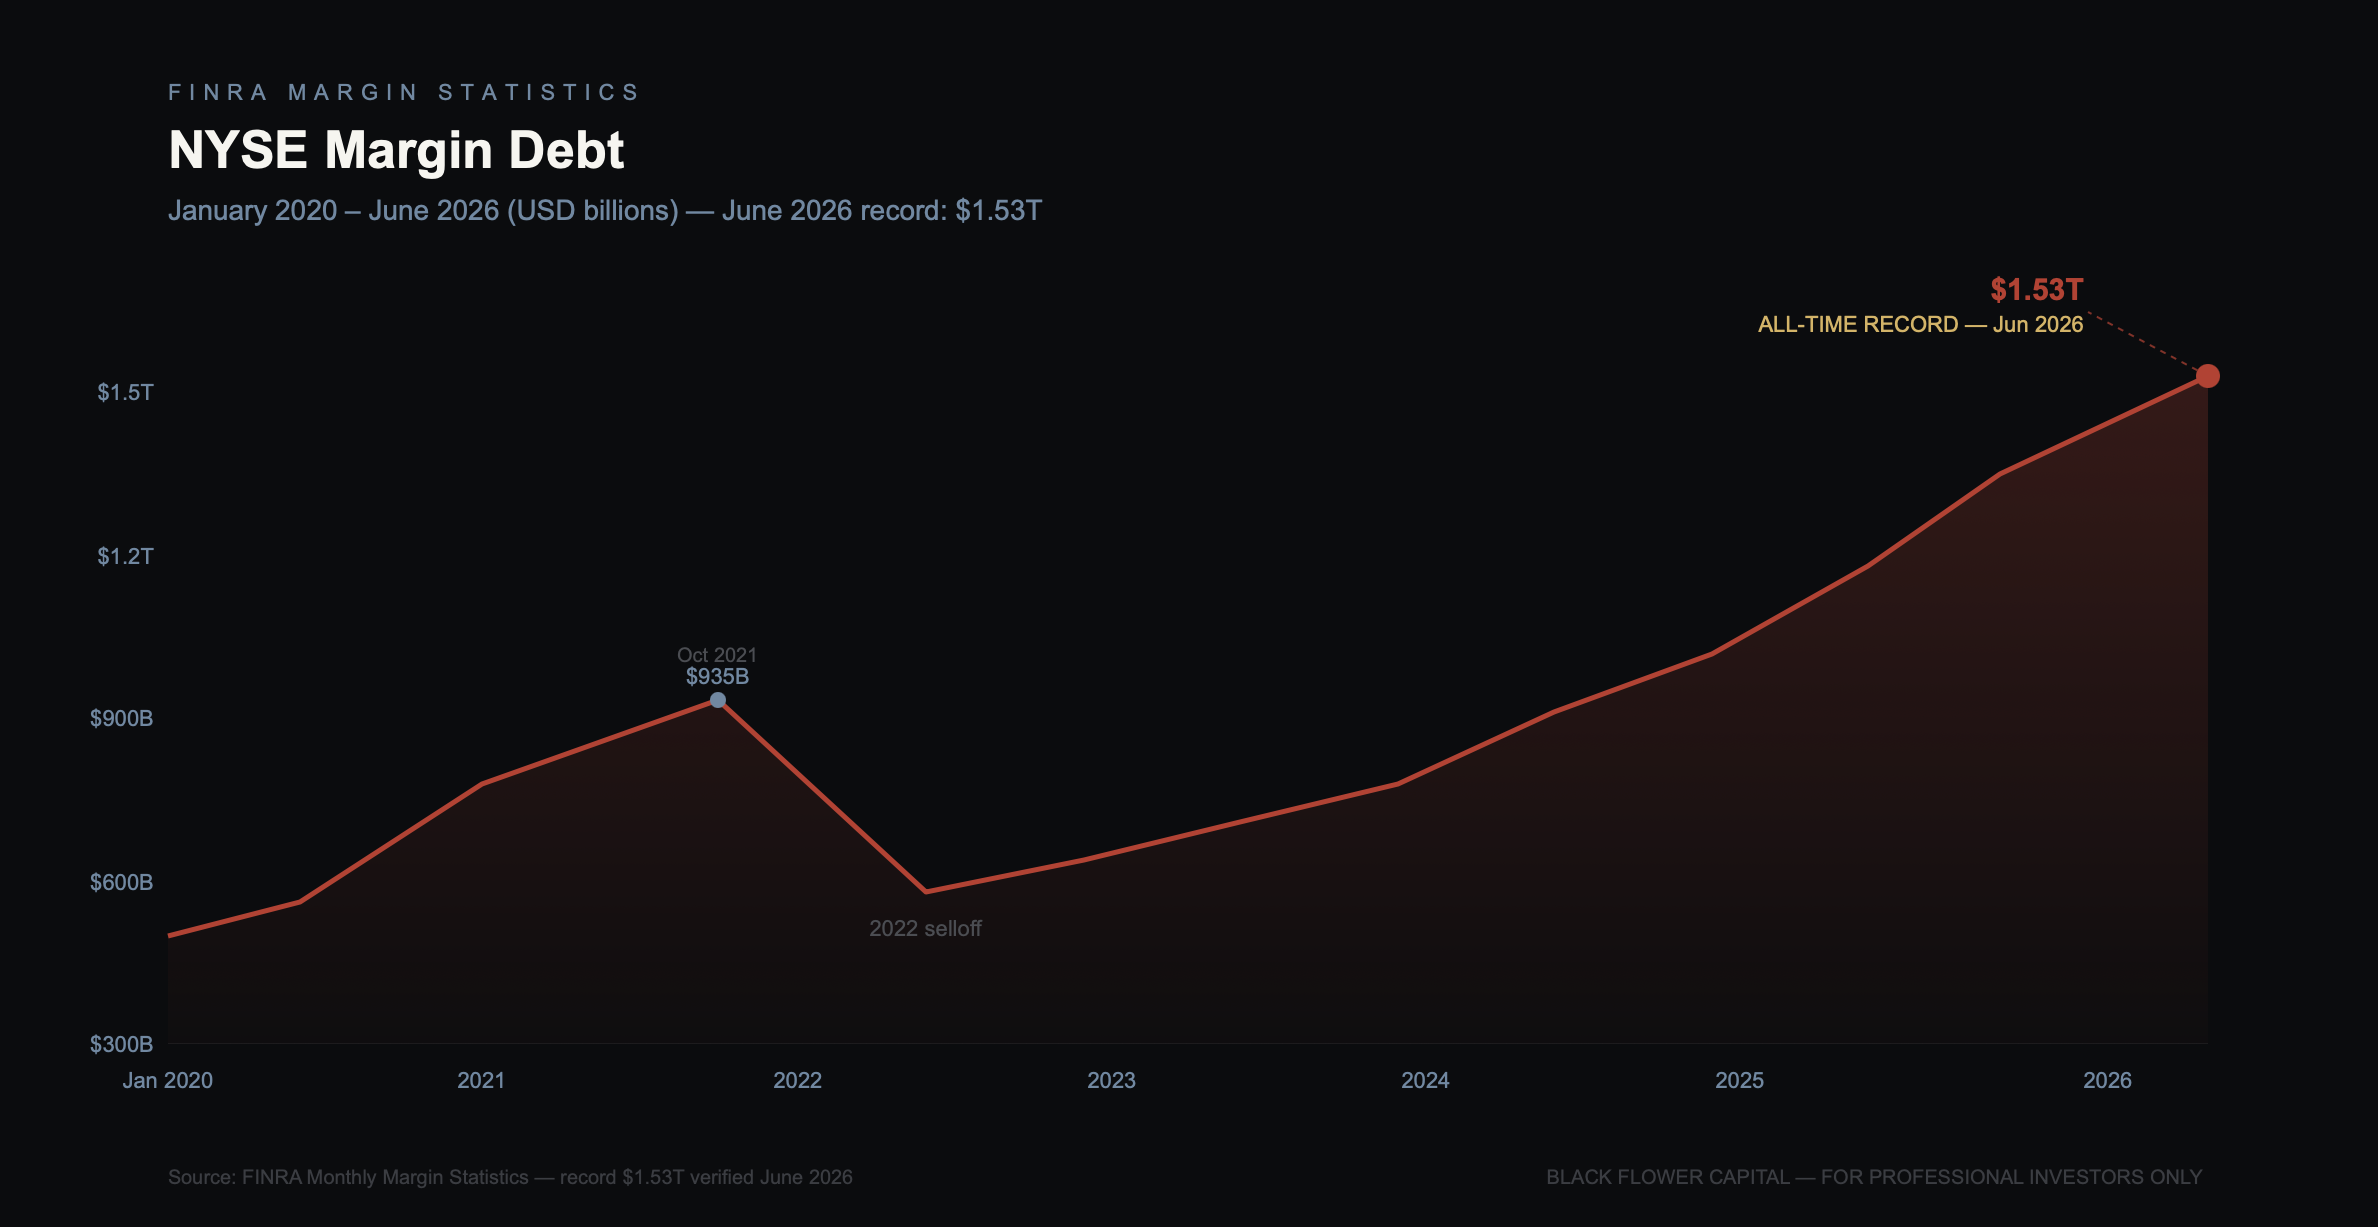
Assets in leveraged ETFs grew from approximately 110 to 220 billion dollars between March 30 and June 3. Barclays estimates that derivatives purchases by leveraged funds since March total approximately 300 billion dollars.
In the Treasury market, Office of Financial Research data published August 19 shows hedge funds holding approximately 2.0 trillion dollars in cash Treasuries against 1.4 trillion dollars in short futures, with the basis trade estimated at approximately one trillion dollars. The IMF Global Financial Stability Report from April 2026 notes that fewer than eight addresses hold nearly half of all positions in two-year Treasury futures, and warns that disorderly unwinding could amplify rate volatility and reveal fragilities in the bond market.
Three leverage sources, three different instruments, one shared condition: all three are profitable while volatility stays low, and all three become sellers when it does not. This is not a forecast. It is a description of the mechanical relationship between current positioning and a volatility regime change.
What July Showed
The Situational Awareness LP liquidation in July 2026 provided a live test of that mechanism. The fund, which had delivered reported returns of approximately 439 percent in the first half of 2026 and managed approximately 45 billion dollars at its peak, sold its entire public equity book of roughly 16 billion dollars to Citadel at a discount, within days of the Philadelphia Semiconductor Index falling 28.6 percent from its June high and the Morgan Stanley Momentum TMT Index falling 53.5 percent. We analysed the structure of that failure in detail in a prior note.
The HFRI data published August 7 provides the broader context. In July 2026, the HFRI Equity Hedge: Technology index posted minus 7.0 percent, the worst monthly return since January 2008. The spread between the top and bottom deciles across the HFRI universe was 20.1 percentage points. The VIX averaged below 16 for the month.
The index did not record the stress. The S&P 500 reached an intraday record of 7,816.70 on August 13. The trailing price-to-earnings ratio stands near 26.
Brian Moynihan, CEO of Bank of America, described the Situational Awareness near-collapse as a warning shot for leveraged markets. The warning shot arrived inside a month in which the headline equity index hit a record.
The 1987 Structure
George Goncalves, Head of US Macro Strategy at MUFG Securities, said in a CNBC interview on August 21 that there are parallels to 1987. The structural elements he identified include: a 30-year yield moving sharply higher against equity market complacency; a new Federal Reserve chair in the first months of the role; an imminent rate decision with meaningful probability of a hike; an energy shock from a Middle East conflict; and an amplifying mechanism embedded in market structure.
In 1987, the amplifier was portfolio insurance: rules-based selling triggered by price declines, which accelerated declines, which triggered further selling. The current equivalents, zero-day options, volatility-targeting strategies, leveraged ETFs, and the Treasury basis trade, share the same mechanical property. They are not directional bets. They are regime-conditional structures that switch from providing liquidity to demanding it when volatility crosses a threshold.
MSCI published analysis in February 2026 describing "triple-red episodes," in which equities, bonds, and the dollar decline simultaneously. It identifies as historical precedents the stagflation of the 1970s and the period following the Plaza Accord, when coordinated dollar weakening coincided with the 1987 equity crash and rising yields. The current configuration, an energy-driven inflation floor preventing rates from falling while growth softens, shares structural features with both periods.
The Calendar
Between September 4 and September 18, the following events are scheduled.
The August employment report is released September 4. The ECB meets September 10 in Berlin, with a rate increase nearly fully priced. US consumer prices for August are released September 11. The FOMC meets September 15 and 16 with an updated dot plot; the probability of a rate increase is approximately one third. The Bank of England meets September 17. The Bank of Japan meets September 17 and 18, with a further increase to 1.25 percent priced into the market.
Before the window opens, Kevin Warsh speaks at Jackson Hole on August 28 alongside the July PCE release and the Bureau of Labor Statistics benchmark revision to payrolls. Nvidia reports second-quarter results on August 26.
The July employment report released in August was minus 23,000 against a consensus of plus 95,000. Prior months were revised down by a combined 103,000.
A structure of declining employment data, energy-driven inflation, four central bank decisions in nine days, and a volatility term structure pricing calm at the front and stress at the back does not constitute a prediction. It is the observable condition before the decisions. The decisions belong to the central banks.
Allocator Implications
The duration position that functioned as a hedge in 2020 and 2021 has changed its behaviour. A bond portfolio that falls when growth weakens, because the long end is responding to supply rather than the economic cycle, is not a hedge against equity risk. It is a correlated loss source. This assumption is failing silently in most balanced portfolios constructed before 2023.
The structural answer is not to move to cash or to short the index. It is to ask whether the crisis protection held in the portfolio has the right causal relationship to the specific failure mode described here. A correlated selling event driven by leverage unwinding and volatility regime change is not necessarily the scenario a long-volatility ETF, a simple put spread, or a gold allocation is designed to address efficiently. The relevant question is whether the protection accelerates into the event or arrives at it late.
The VIX futures term structure, September futures at 17.92 against a spot of 14.25, is pricing forward stress at the cheapest level of the year relative to realized volatility. The CFTC data confirms that the crowd is positioned in the opposite direction. Both facts are verifiable, sourced from primary data, and do not require a view about whether the central banks will hike, hold, or surprise.
The window before the decisions is finite. The decisions belong to the central banks.
Sources: US Treasury Daily Yield Curve Rates; US Treasury TIC data (August 2026); CNBC; Bloomberg; BLS; FOMC; CME FedWatch; CFTC Commitments of Traders (published 21.08.2026); FINRA Monthly Margin Statistics; Office of Financial Research (19.08.2026); IMF Global Financial Stability Report (April 2026); HFR (07.08.2026); Cboe; Capital Economics; Congressional Budget Office; CRFB; Barclays Research; JPMorgan Chase Research; Morgan Stanley; Monex Group; MUFG Securities; MSCI (February 2026). All figures with dates as noted.
This publication is issued by Black Flower Capital GmbH (Zug, Switzerland) and Black Flower Capital Management SARL (Luxembourg). It is intended for professional and institutional investors only, is provided for information purposes only, and does not constitute investment advice, an offer, or a solicitation to buy or sell any financial instrument. Past performance is not indicative of future results.